


Let’s face it: running a business is no small feat. With so many moving parts, keeping track of everything can feel like a never-ending challenge.
That’s where FP&A dashboards come in. Think of them as your business’s control center, where all the important data comes together in one place. They give you the power to make better decisions faster and more confidently.
In this post, we’re diving into the five key insights every FP&A dashboard should provide to help you unleash your business’s full potential.
Let’s jump in and see how these insights can transform the way you manage your business.
1. The Overview: Your Business at a Glance
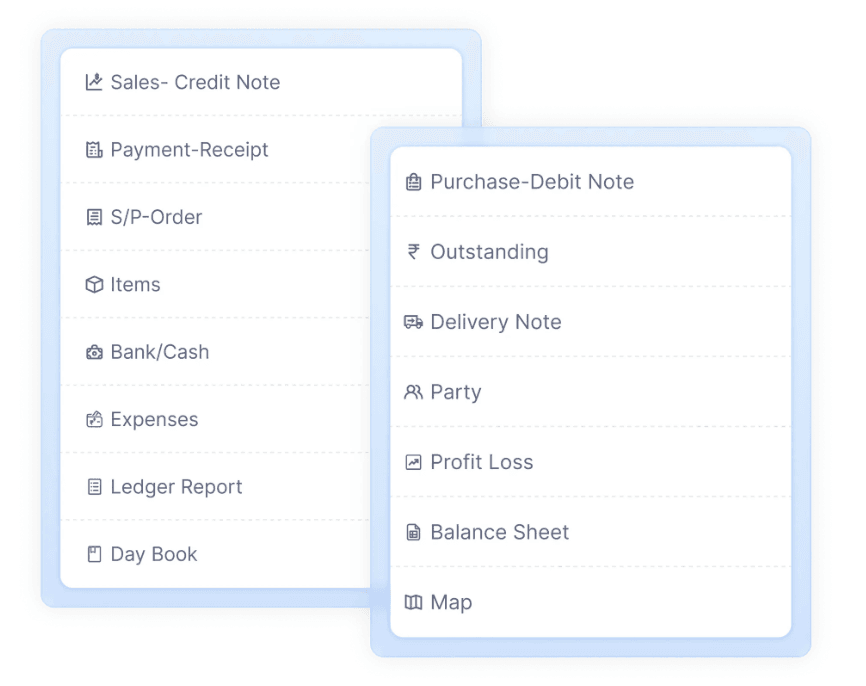
The Overview section is the heart of your FP&A dashboard. It pulls together all your critical financial information into one easy-to-digest snapshot. We're talking sales, purchases, payables versus receivables, and even things like credit notes.
What’s great about this is that it gives you a clear picture of your business’s financial health. From cash flow to assets and liabilities, you can quickly see where things stand.
This helps you make decisions on the fly and plan for the future. Whether you're looking for opportunities to grow or areas to improve, the Overview ensures you're always in control.
It’s not just about checking numbers—it’s about understanding them, spotting trends, and steering your business in the right direction.
2. Transaction Analysis: Seeing the Bigger Picture
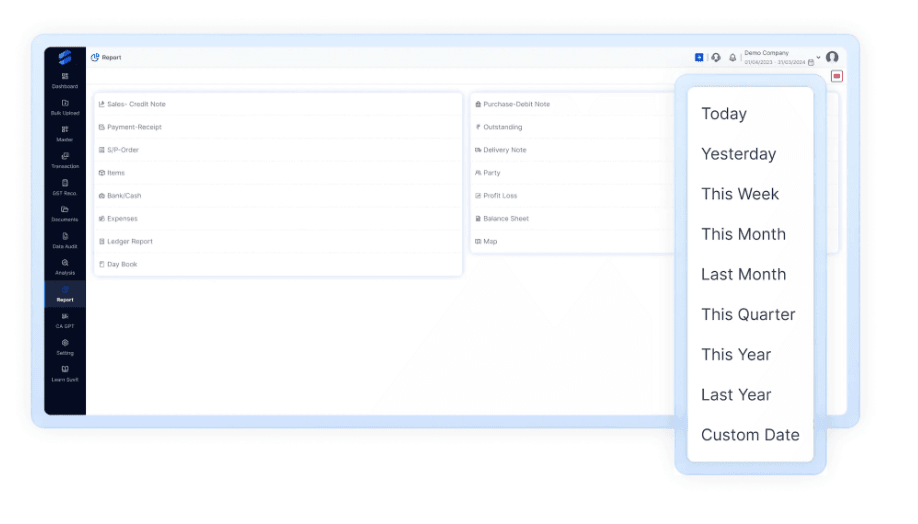
Next up is the Transaction Analysis feature. This one’s a game-changer. It lets you filter and analyze your financial transactions over different periods—monthly, quarterly, or even yearly.
This flexibility makes it super easy to spot patterns and trends in your business.
Maybe you notice your sales peak during certain months, or that expenses tend to rise at specific times of the year. With these insights, you can better plan your budget, forecast future spending, and prepare for seasonal fluctuations.
Plus, it gives you a crystal-clear view of your financial activity so you’re never caught off guard.
Using your FP&A dashboard to analyze transactions helps you keep a closer eye on your business’s financial pulse, giving you the tools you need to plan smarter.
Also Read: 6 Must-Have Features in Automated Accounting Software
3. Accounting Details: Get a Clear Picture of Your Finances
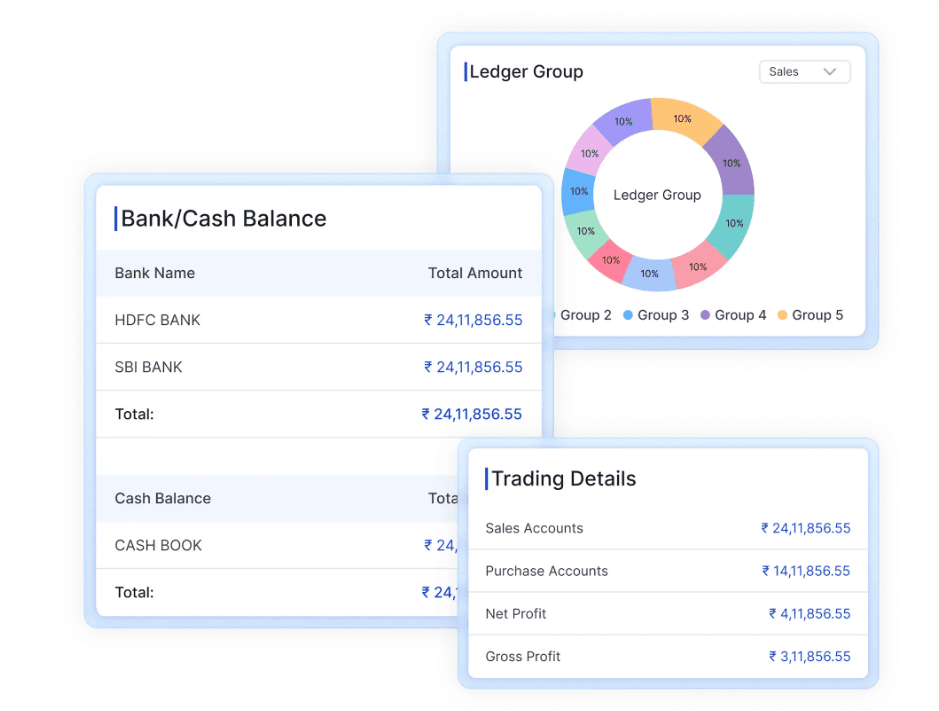
The Accounting Details section is all about clarity. It gives you an at-a-glance view of your bank and cash balances, so you always know where your finances stand.
But it doesn’t stop there. You also get to see detailed breakdowns of payments, categorized by ledger group and voucher type.
Why is this important? Because it helps you stay on top of things like payment obligations, pending transactions, and overall liquidity.
You don’t have to guess where you’re at financially—you’ll know instantly. It’s a simple way to stay in control of your cash flow and keep your business running smoothly.
4. Top Performers: Shining a Light on What Works
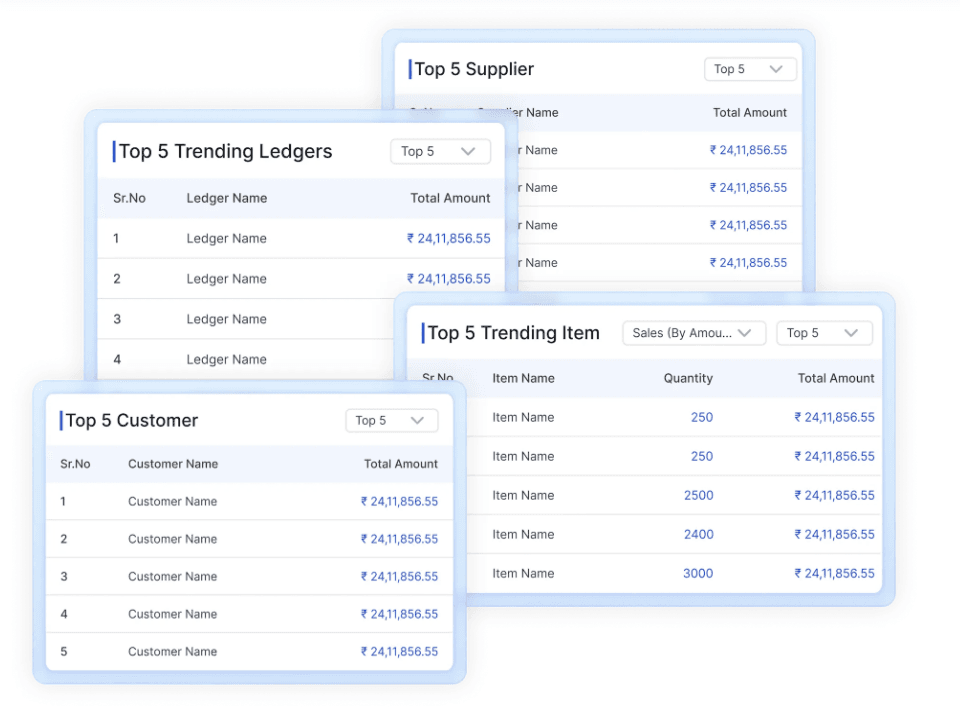
Every business has its stars—a standout product, a loyal customer, or a reliable supplier. The Top Performers feature of your FP&A dashboard helps you precisely identify who or what is driving your business forward.
This insight lets you focus your efforts where they matter most. You can recognize your best customers, products, and suppliers, which can help you nurture those relationships and grow your revenue. Plus, the ability to customize this section means you can highlight the metrics that matter most to your unique business goals.
Celebrating and understanding your top performers ensures you're not just reacting to data but actively using it to grow your business.
5. Trends and Analysis: Staying Ahead of the Curve
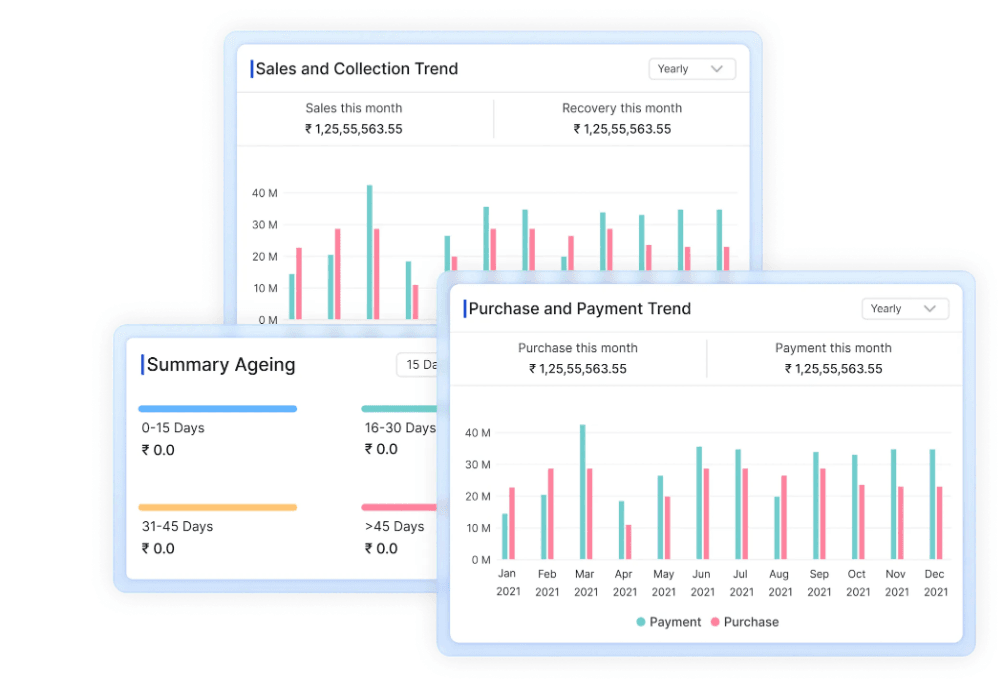
The Trends and Analysis section is your dashboard’s crystal ball. It helps you track and compare financial trends over time. You can see how things are shifting and evolving, whether it's sales, collections, purchases, or payments.
What makes this so powerful is that you can compare different financial trends. This gives you a clear view of your business's performance over time. Plus, you can dive deeper into ageing data for receivables and payables, which is key for staying on top of your financial health.
By identifying trends early, you can make proactive decisions that keep you ahead of the competition. It’s all about being prepared and ensuring your business is always in a strong position.
Also Read: Work Smarter, Not Harder: Invoice Automation with Suvit
Ready to Supercharge Your Business?
So, there you have it! These five insights are essential for taking your FP&A dashboard to the next level. Whether you want a better understanding of your business’s financial health, a way to spot trends or an easy way to stay on top of your accounting, these features have covered you.
And if you’re looking for a platform that makes it all simple and intuitive, Suvit is here to help. With Suvit’s FP&A dashboard, you can easily automate processes like GST reconciliation and invoice automation. Plus, it’s customizable, so it fits your business’s unique needs. Need more space? Enjoy unlimited cloud storage for all your documents.
Still not convinced? Try Suvit for free with a seven-day trial and see the difference it can make for your business!
By unlocking the full potential of your FP&A dashboard, you’ll be able to make smarter, more data-driven decisions and set your business up for long-term success. So, are you ready to get started? Let’s do this!


